Debugging Kiali
Logs
The most basic way of debugging the internals of Kiali is to examine its log messages. A typical way of examining the log messages is via:
kubectl logs -n istio-system deployment/kiali
Each log message is logged at a specific level. The different log levels are trace, debug, info, warn, error, and fatal. By default, log messages at info level and higher will be logged. If you want to see more verbose logs, set the log level to debug or trace (trace is the most verbose setting and will make the log output very “noisy”). You set the log level in the Kiali CR:
spec:
  deployment:
    logger:
      log_level: debug
Tracing
Kiali provides the ability to emit debugging traces to the distributed tracing platform, Jaeger or Grafana Tempo.
The traces can be sent in HTTP, HTTPS or gRPC protocol. It is also possible to use TLS. When tls_enabled is set to true, one of the options skip_verify or ca_name should be specified.
The traces are sent in OTel format, indicated in the collector_type setting.
server:
  observability:
    tracing:
      collector_type: "otel"
      collector_url: "jaeger-collector.istio-system:4317"
      enabled: false
      otel:
        protocol: "grpc"
        tls_enabled: true
        skip_verify: false
        ca_name: "/tls.crt"
Usually, the tracing platforms expose different ports to collect traces in distinct formats and protocols:
- The Jaeger collector accepts OpenTelemetry Protocol over HTTP (4318) and gRPC (4317).
- The Grafana Tempo distributor accepts OpenTelemetry Protocol over HTTP (4318) and gRPC (4317). It can be configured to accept TLS.
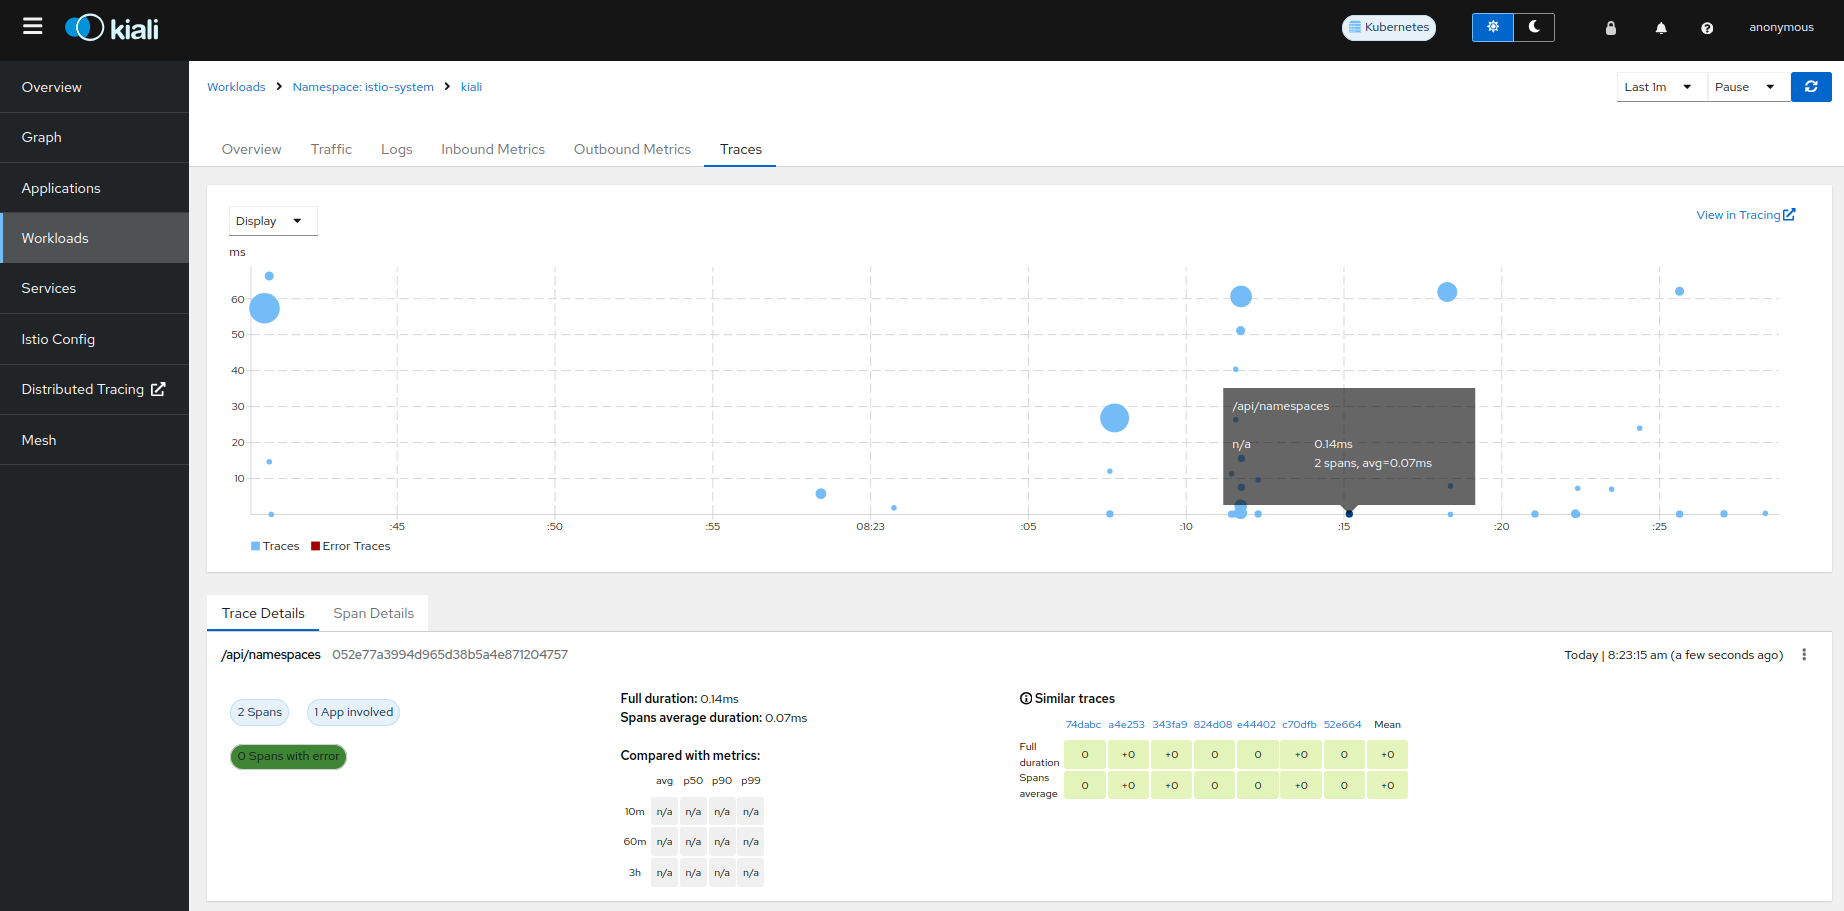
The traces emitted by Kiali can be searched in the Kiali workload:

Profiler
The Kial Server is integrated with the Go pprof profiler. By default, the integration is disabled. If you want the Kiali Server to generate profile reports, enable it in the Kiali CR:
spec:
  server:
    profiler:
      enabled: true
Once the profiler is enabled, you can access the profile reports by pointing your browser to the <kiali-root-url>/debug/pprof endpoint and click the link to the profile report you want. You can obtain a specific profile report by appending the name of the profile to the URL. For example, if your Kiali Server is found at the root URL of “http://localhost:20001/kiali”, and you want the heap profile report, the URL http://localhost:20001/kiali/debug/pprof/heap will provide the data for that report.
Go provides a pprof tool that you can then use to visualize the profile report. This allows you to analyze the data to help find potential problems in the Kiali Server itself. For example, you can start the pprof UI on port 8080 which allows you to see the profile data in your browser:
go tool pprof -http :8080 http://localhost:20001/kiali/debug/pprof/heap
You can download a profile report and store it as a file for later analysis. For example:
curl -o pprof.txt http://localhost:20001/kiali/debug/pprof/heap
You can then examine the data found in the profile report:
go tool pprof -http :8080 ./pprof.txt
Your browser will be opened to http://localhost:8080/ui which allows you to see the profile report.
Kiali CR Status
When you install the Kiali Server via the Kiali Operator, you do so by creating a Kiali CR. One quick way to debug the status of a Kiali Server installation is to look at the Kiali CR’s status field (e.g. kubectl get kiali --all-namespaces -o jsonpath='{..status}'). The operator will report any installation errors within this Kiali CR status. If the Kiali Server fails to install, always check the Kiali CR status field first because in many instances you will find an error message there that can provide clear guidance on what to do next.